COVID-19

COVID-19 Pandemic in South America
View the Project on GitHub bgonzalezbustamante/COVID-19-South-America
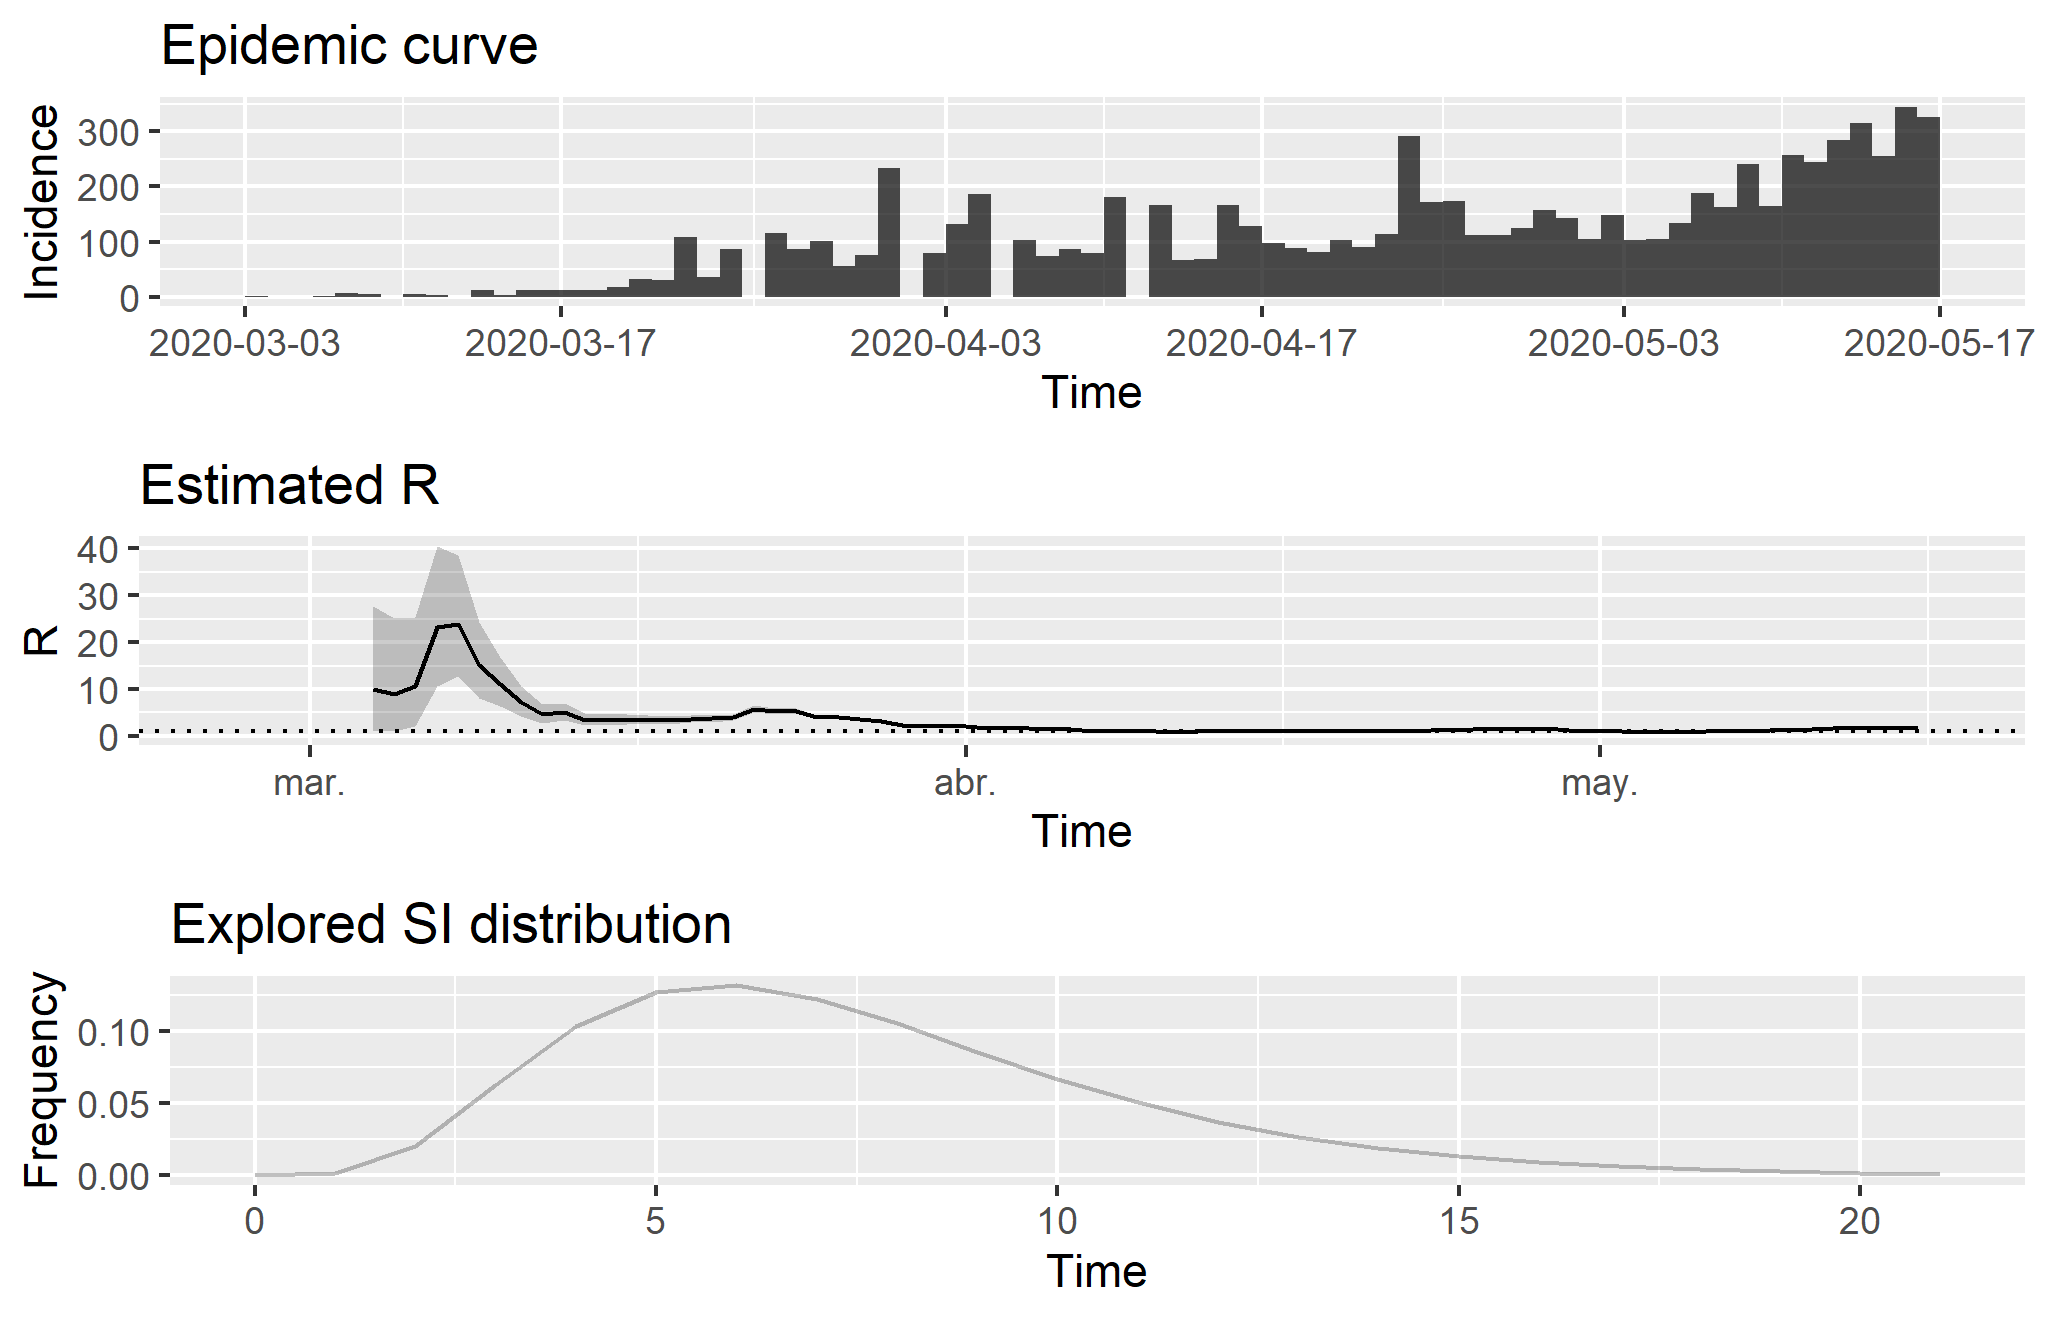
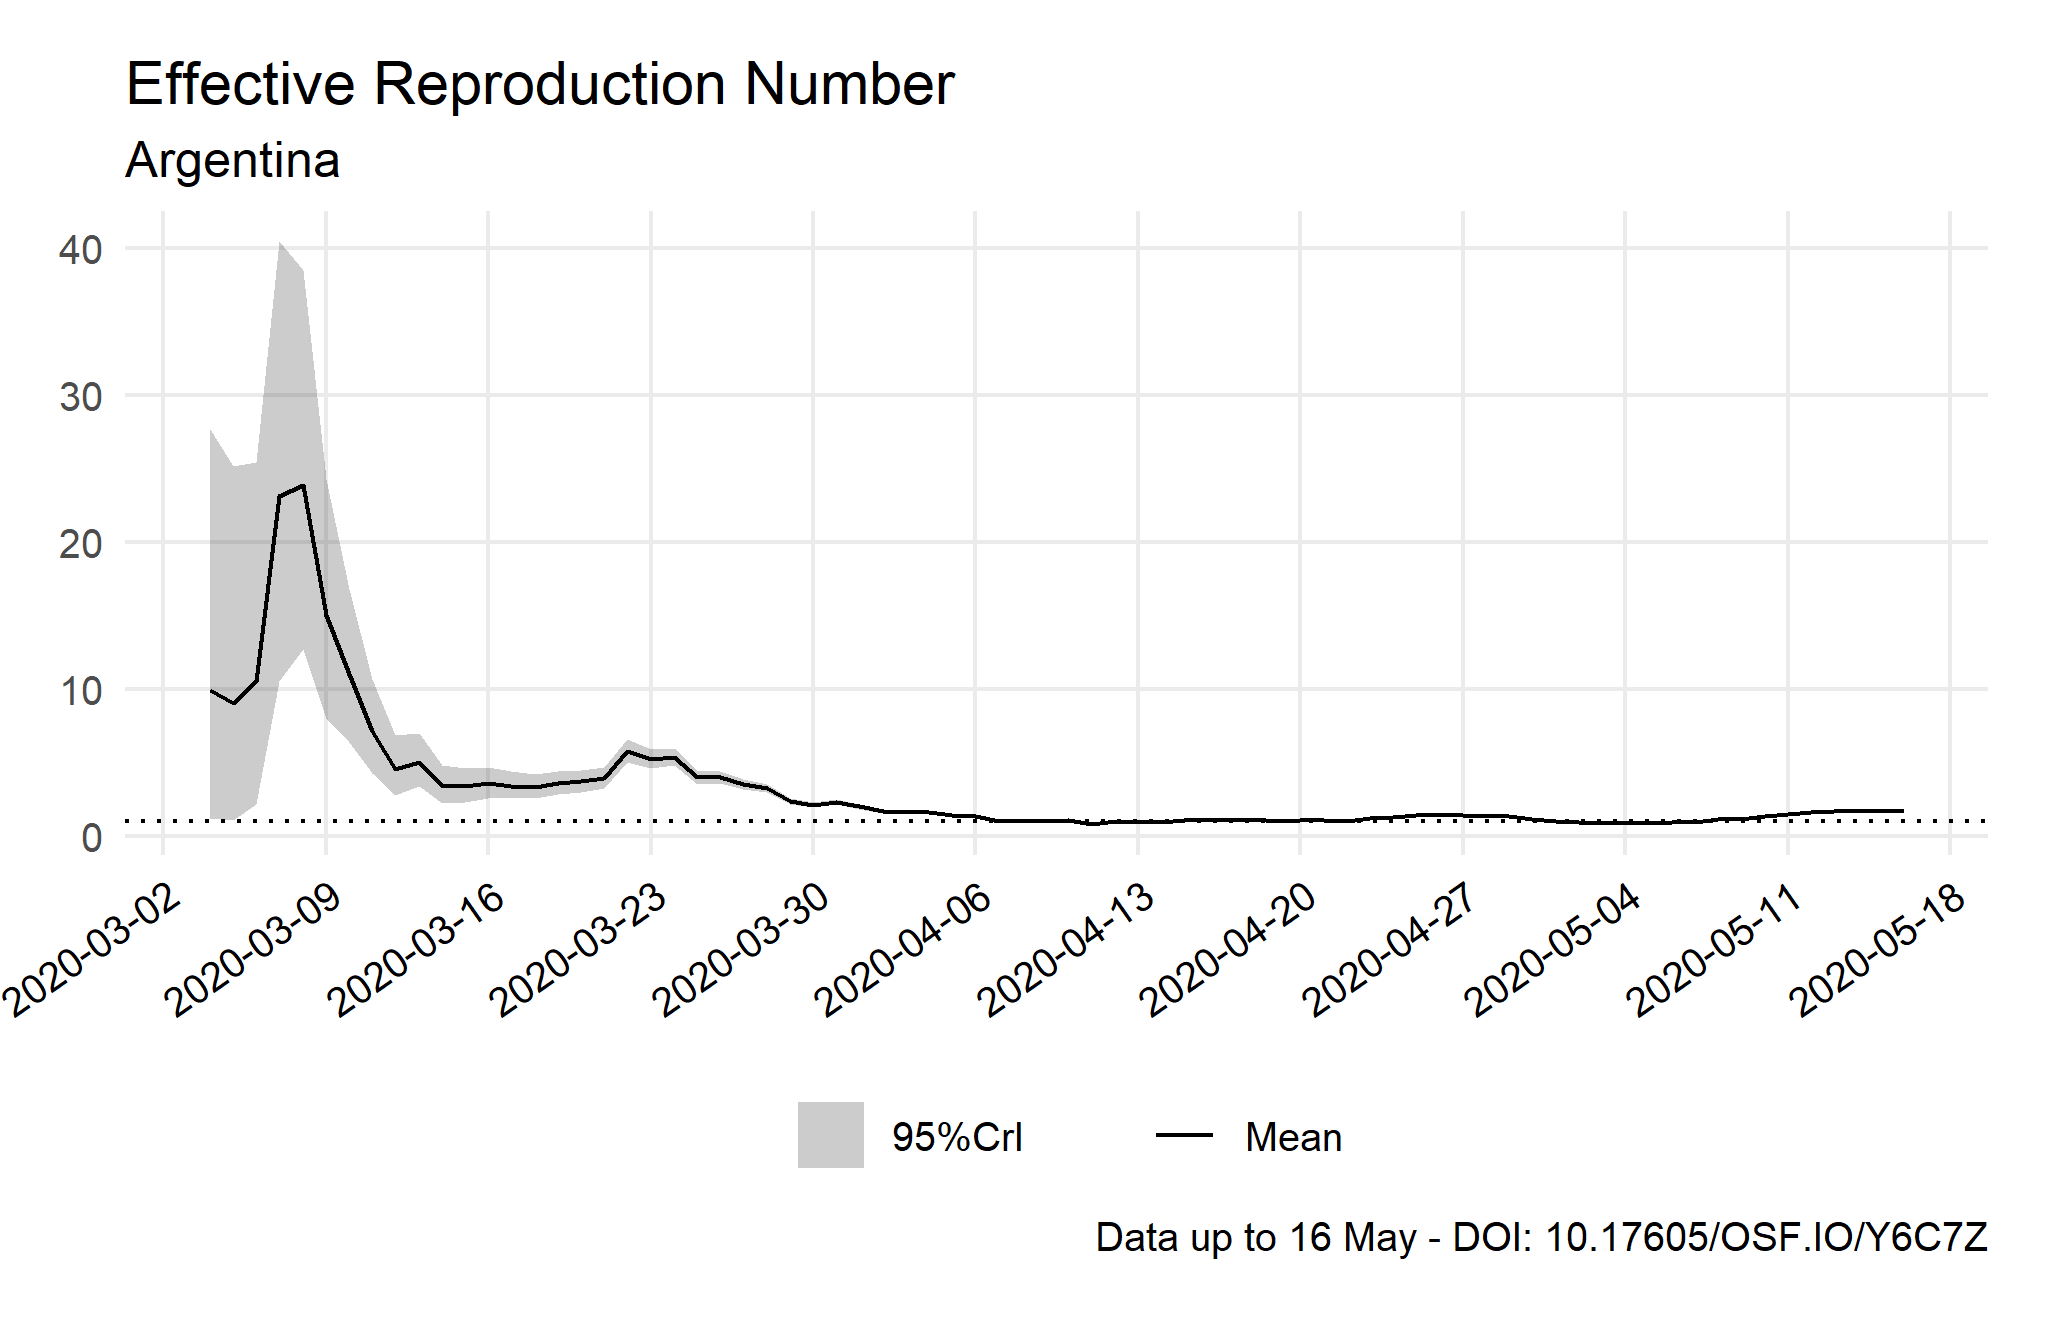
Estimated R and Explored Serial Interval Distribution in Argentina
This online tracker was deprecated in mid-May 2020 to focus on a paper which evaluates early projections and governmental responses to COVID-19 epidemic in South America. This paper was published in World Development journal (DOI: 10.1016/j.worlddev.2020.105180). See its demonstration for R.
 Source: Compiled using data from the Johns Hopkins University CSSE COVID-19 Dataset.
Note: The estimations have been calculated with a parametric serial interval based on a Gamma distribution with mean μ = 7.5 and standard deviation σ = 3.4 following to Li et al. (2020). The epicurve shows new infections over the period. On the other hand, estimated R illustrates the number of infections that a single case generates: when the value is lower than one, the outbreak is under control (see figure in detail). R is specifically the effective reproduction number (Re), which is calculated on a daily incidence basis. Therefore, it allows us to measure the public health systems response (see Cori et al., 2013; see also Thomson et al., 2019). Finally, the explored serial interval (SI) distribution shows the time interval between the symptoms in each case and the onset of them in secondary cases because of transmission. It is relevant to note that these estimations are too early in this epidemic to obtain a reliable posterior coefficient of variation of the R indicator.
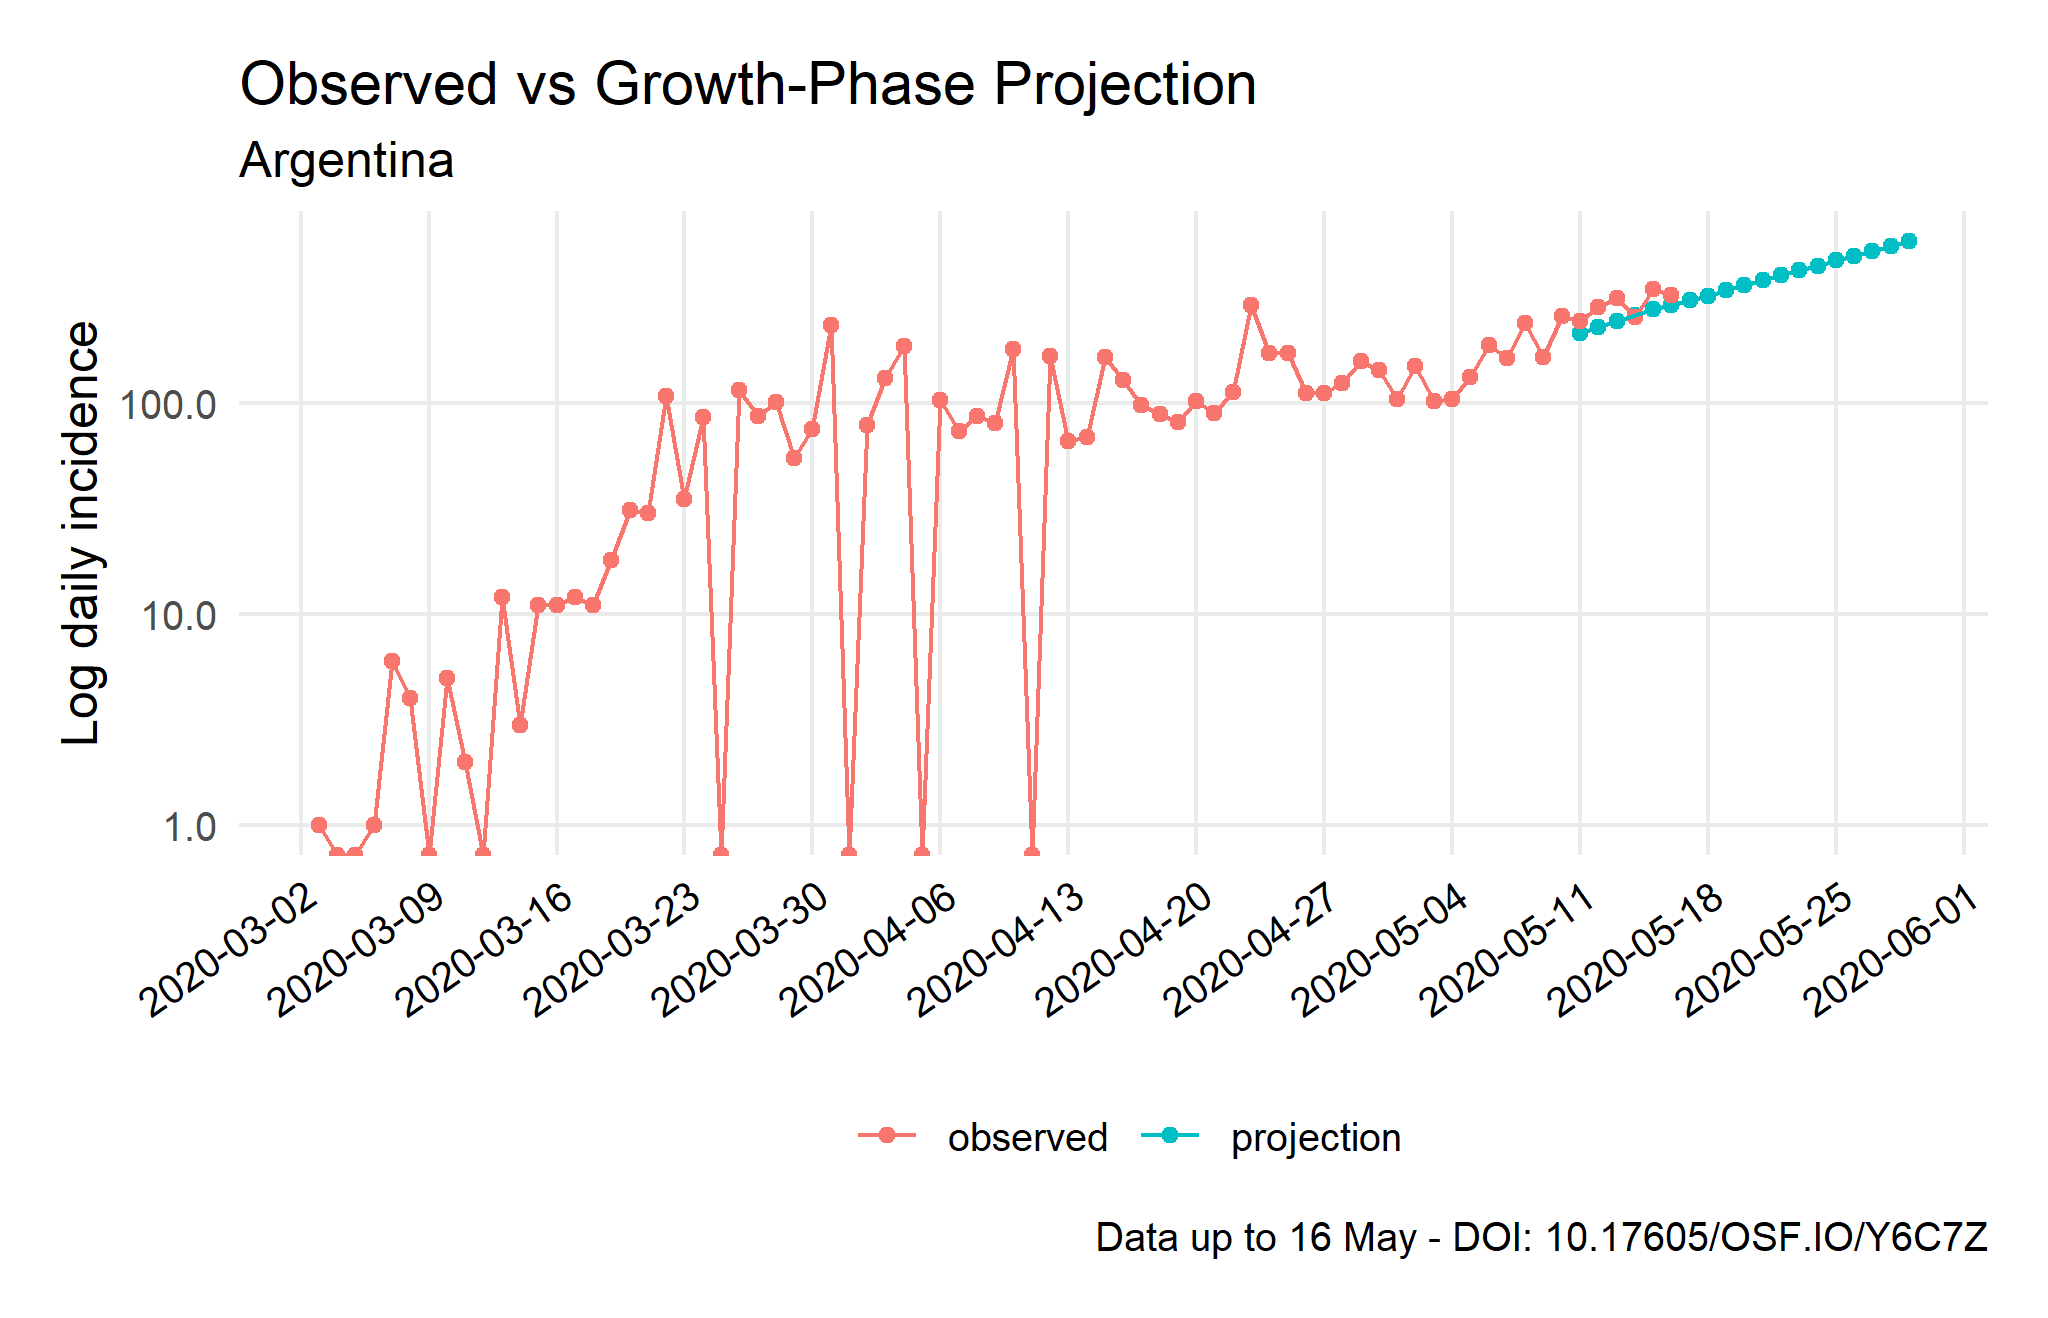
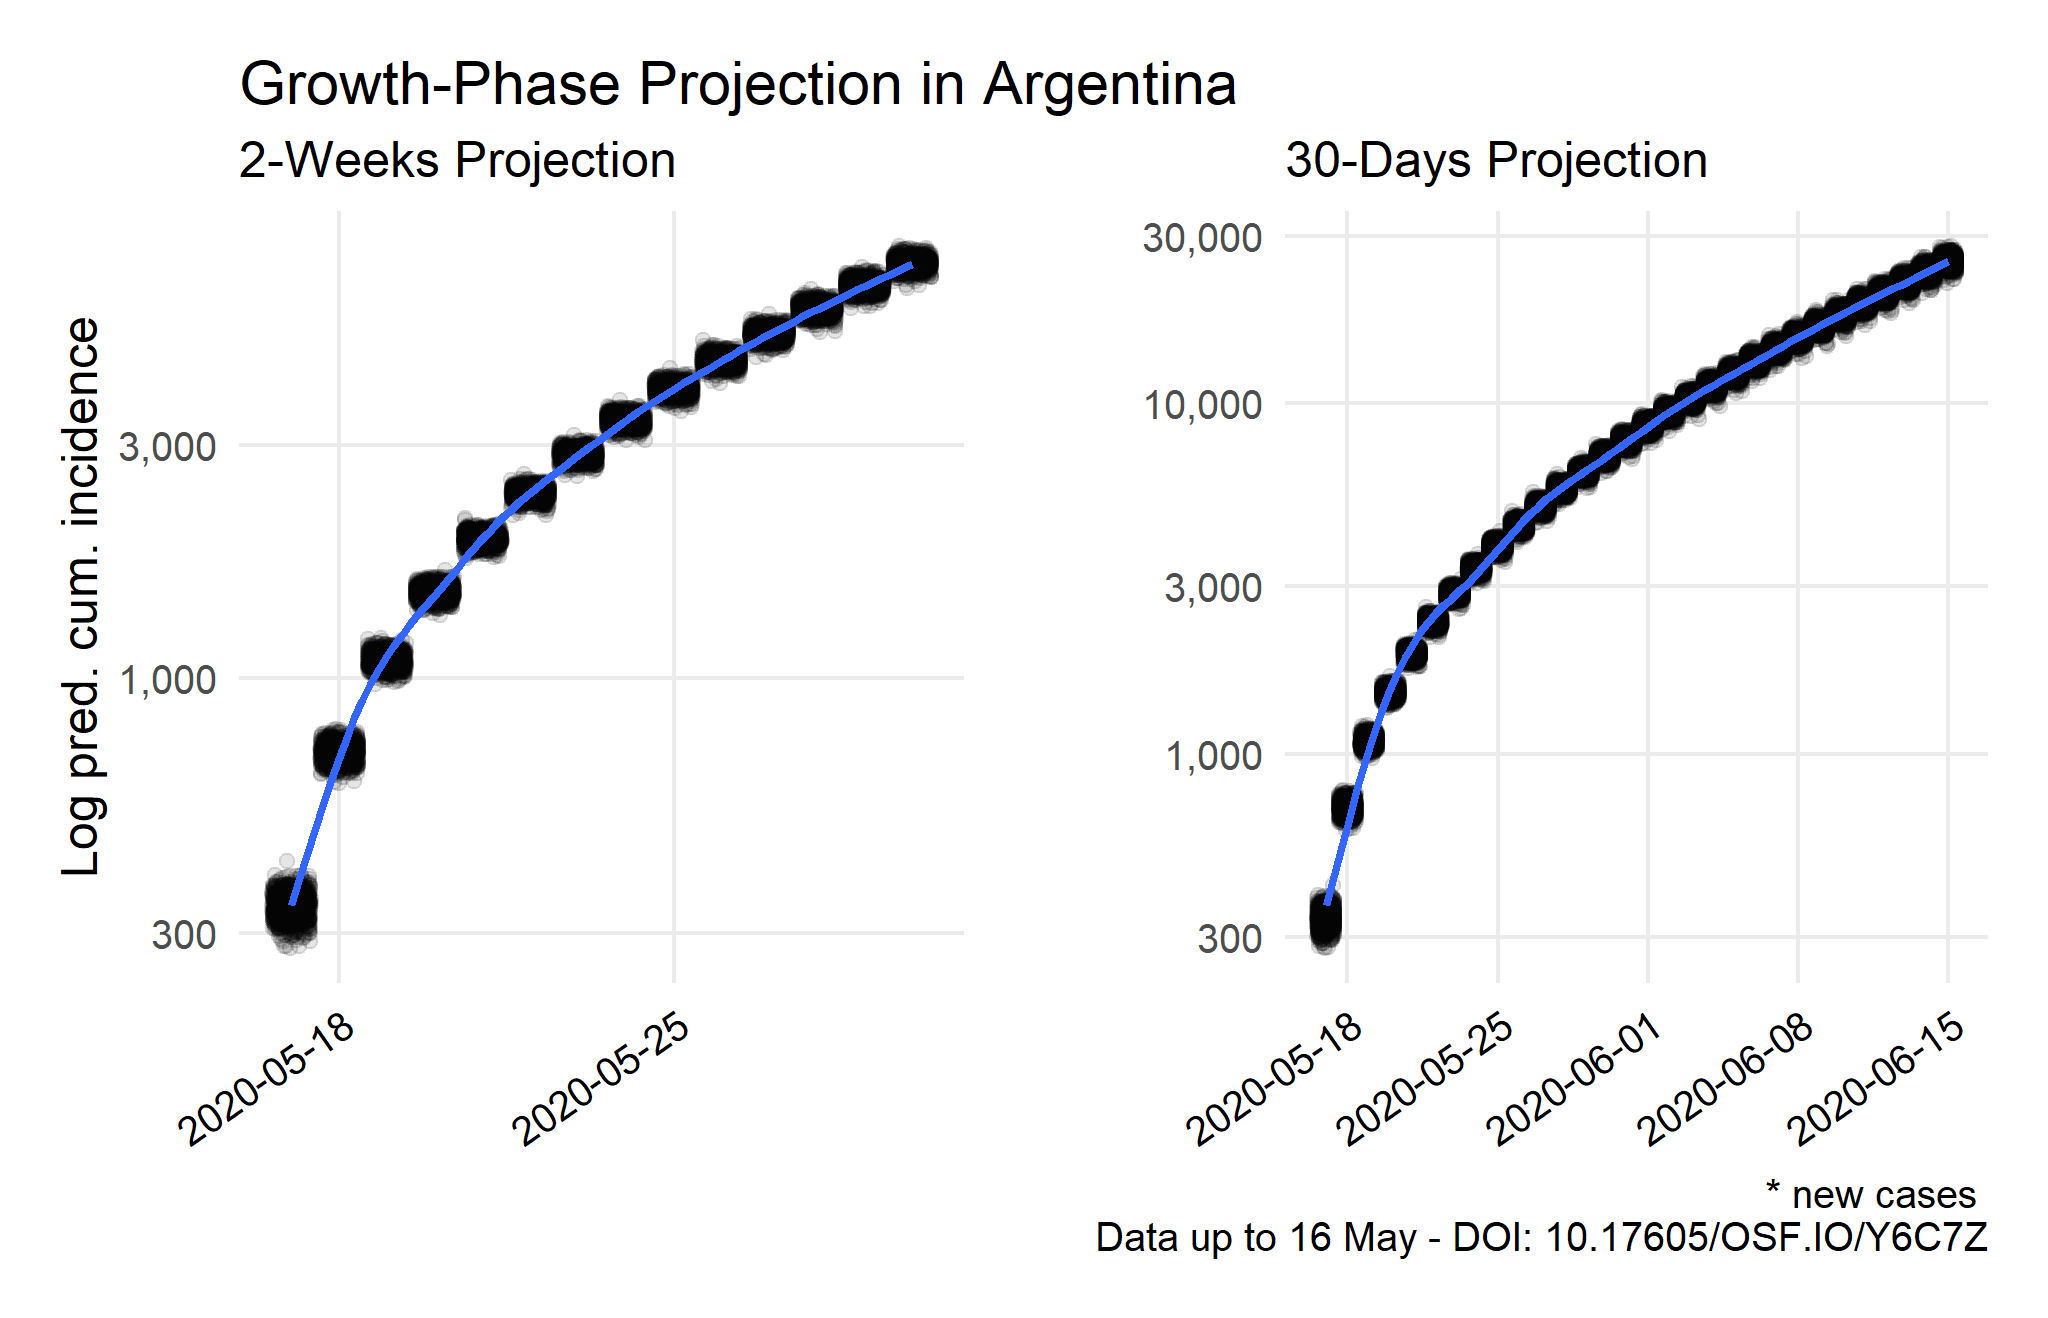
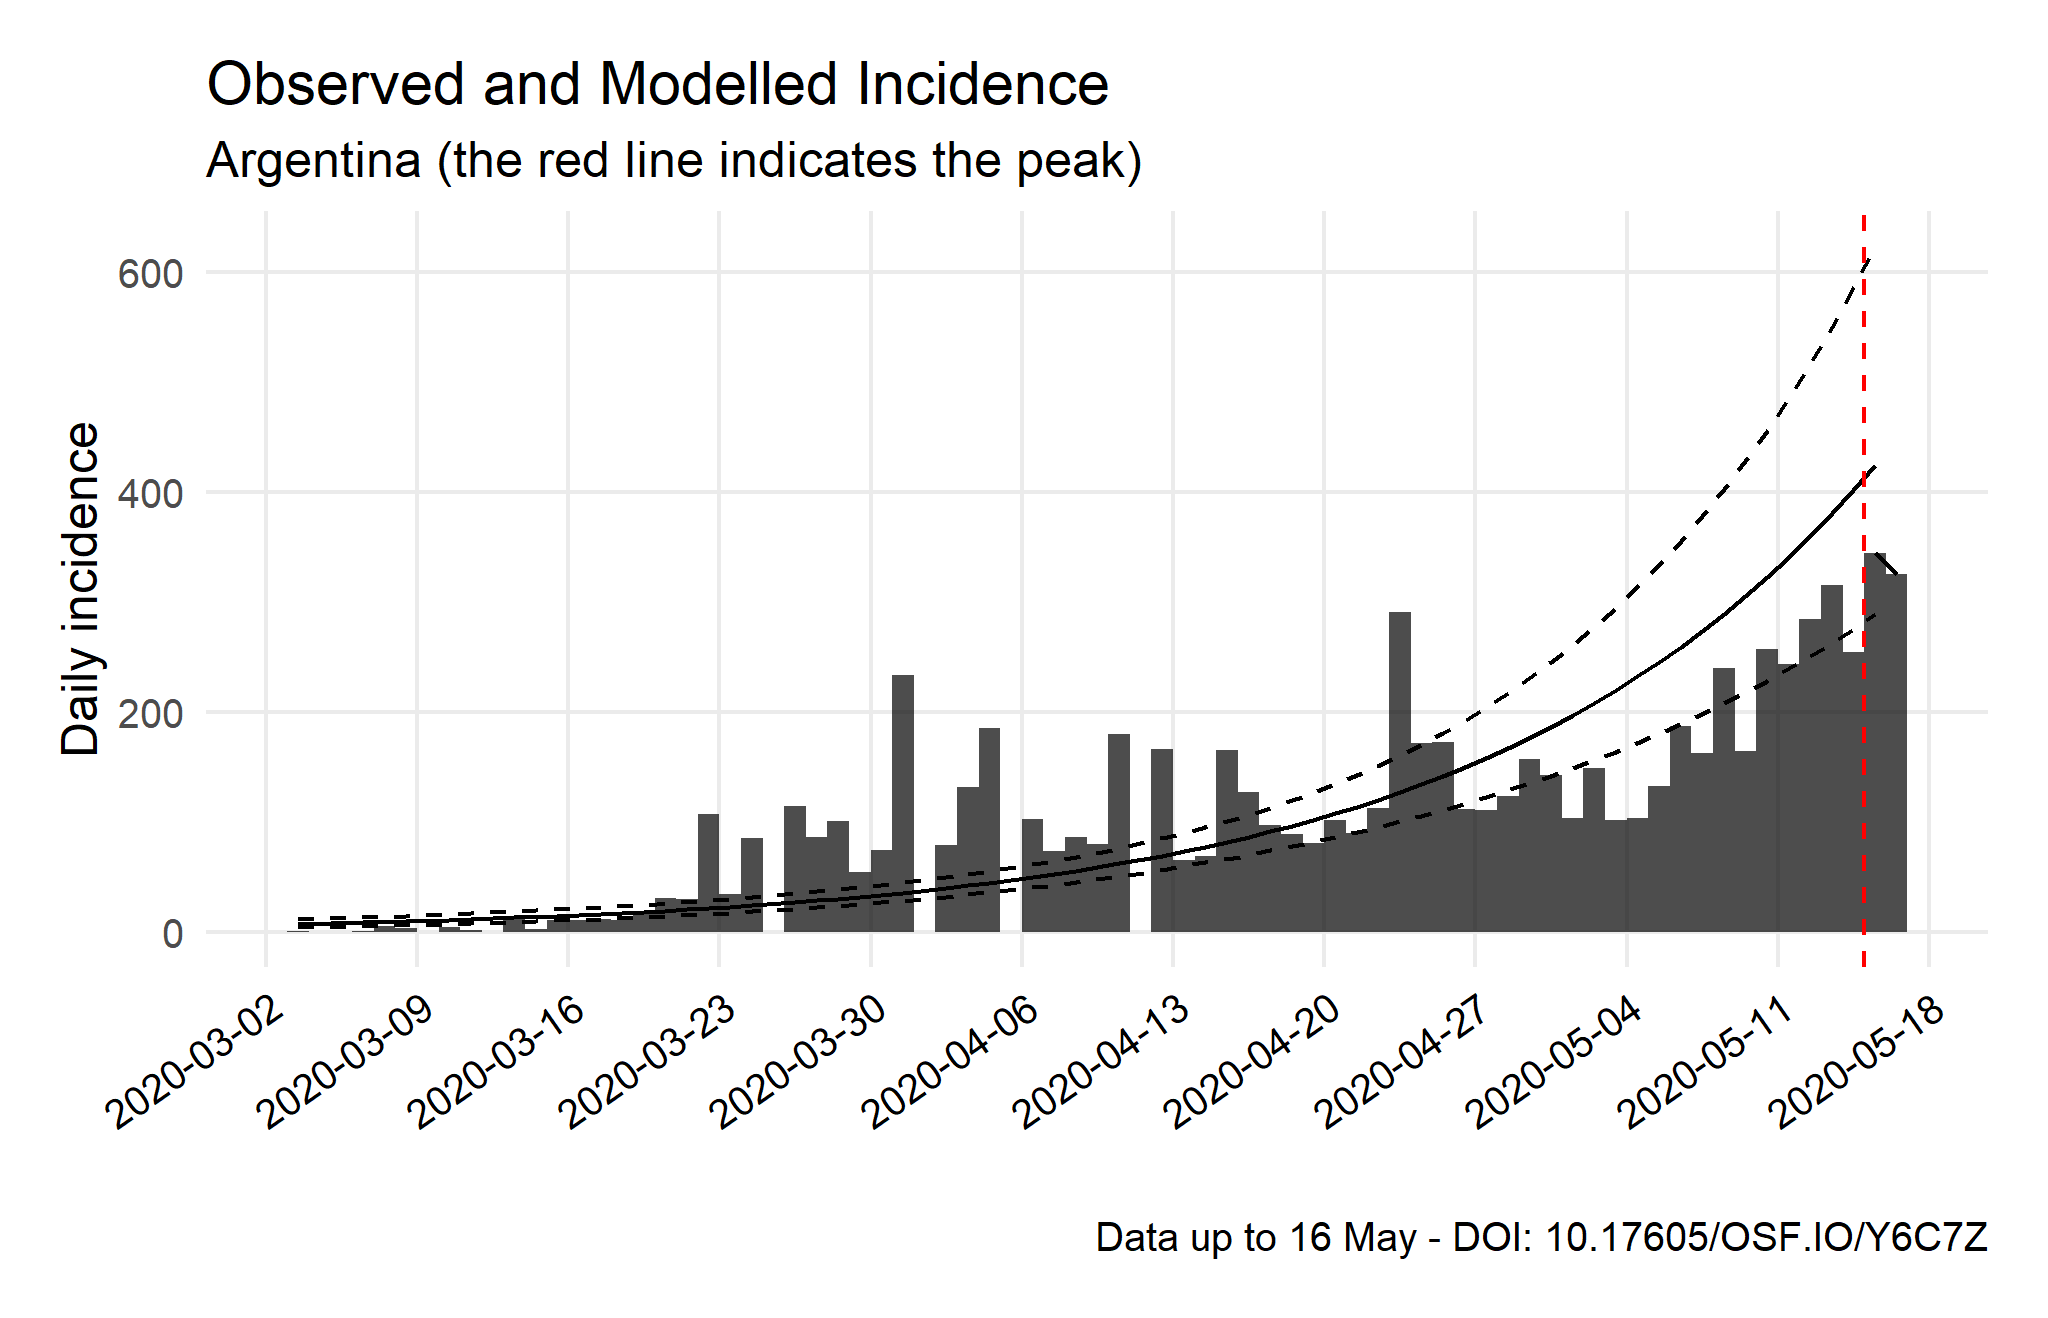
Epidemic Trajectory and Future Incidence Simulation
 Source: Compiled using data from the Johns Hopkins University CSSE COVID-19 Dataset.
Note: In this country, the average of secondary cases is calculated based on the R indicator and its posterior coefficient of variation. The R daily growth rate, on the one hand, is obtained from the first component of a log-incidence regression over the period. On the other hand, the posterior coefficient of variation of the R indicator is elaborated with a parametric serial interval based on a Gamma distribution with the Li et al. (2020) values. Although it is still early in the epidemic to obtain robust results, this is a stronger assumption than a maximum-likelihood estimation of R, which could be more useful to measure earlier outbreaks. After that, 1,000 futures epicurves are simulated from the five days before the current peak, which is not necessarily the real growth-phase peak, to the next two weeks to compare observed and predicted values.
 Source: Compiled using data from the Johns Hopkins University CSSE COVID-19 Dataset.
Note: The predicted cumulative incidence of new cases is estimated from the current peak to the following 30-days with 1,000 simulated epicurves per day based on the previous estimation. When the epidemic peak is confirmed, the R daily decay rate of the log-incidence model should be used to measure the decay-phase adequately (see possible peak). It is relevant to note this will decrease the projections significantly. For further details, see the technical note.
Were You Looking for Previous Figures?
See the Visualisation COVID-19 component of the OSF-Project (DOI: 10.17605/OSF.IO/Y6C7Z)